Get accurate analyses of your data, receive user-friendly reports in your inbox and get an overview of your indoor climate with the smart features of our RoomAlyzer platform.
Report and warnings
Our reporting module delivers accurate data directly to your inbox with daily, weekly and monthly indoor climate summaries. You can also send the reports to other users and customise which indoor climate values to include. In addition, the module offers both application and DGNB reports that are ready to use for your DGNB certification, so you don’t have to spend time on Excel.
The warning function notifies you when the indoor climate deviates from the desired level. Early warnings about high humidity, for example, can save you significant costs. You can choose to receive alerts via SMS or email and assign alerts to different recipients.
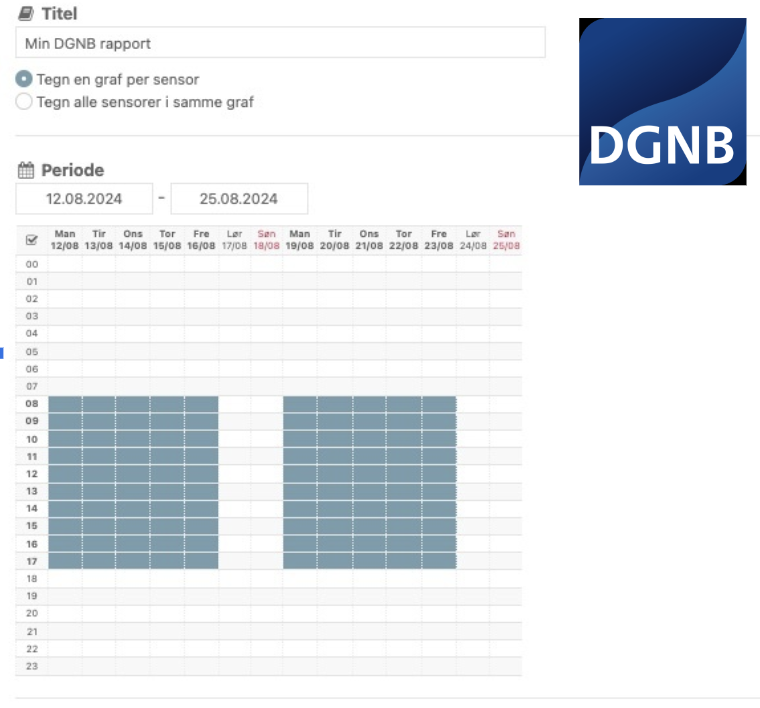
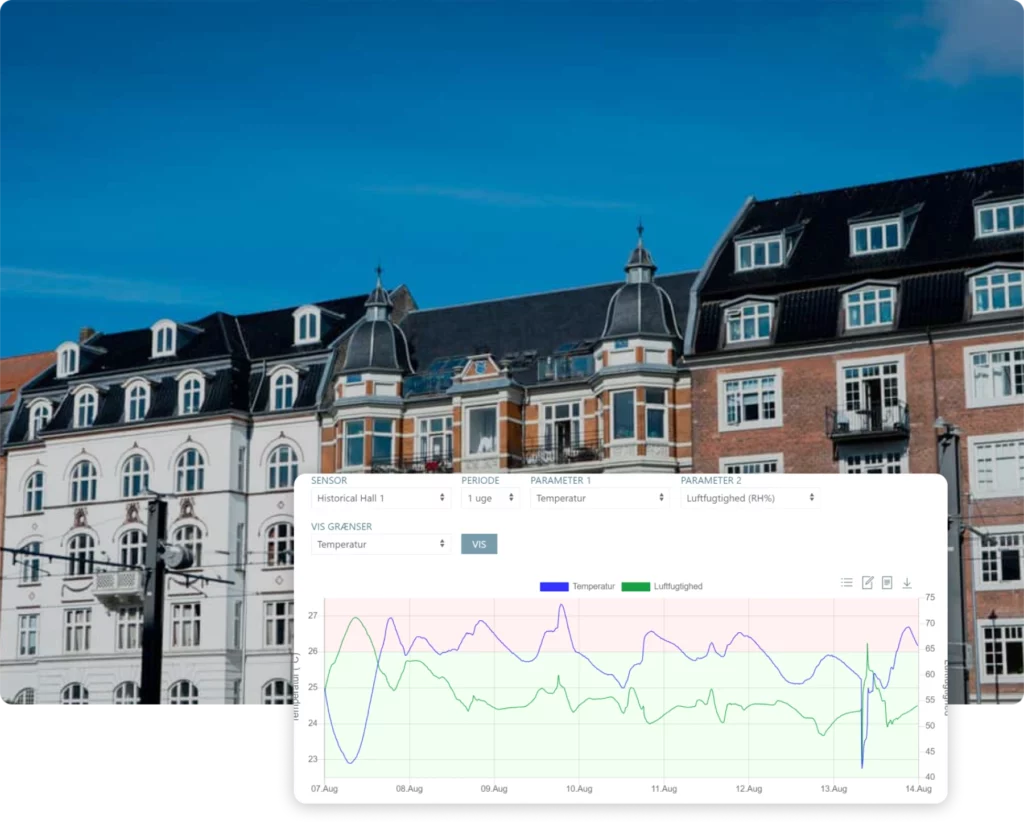
Graphs and DGNB reporting
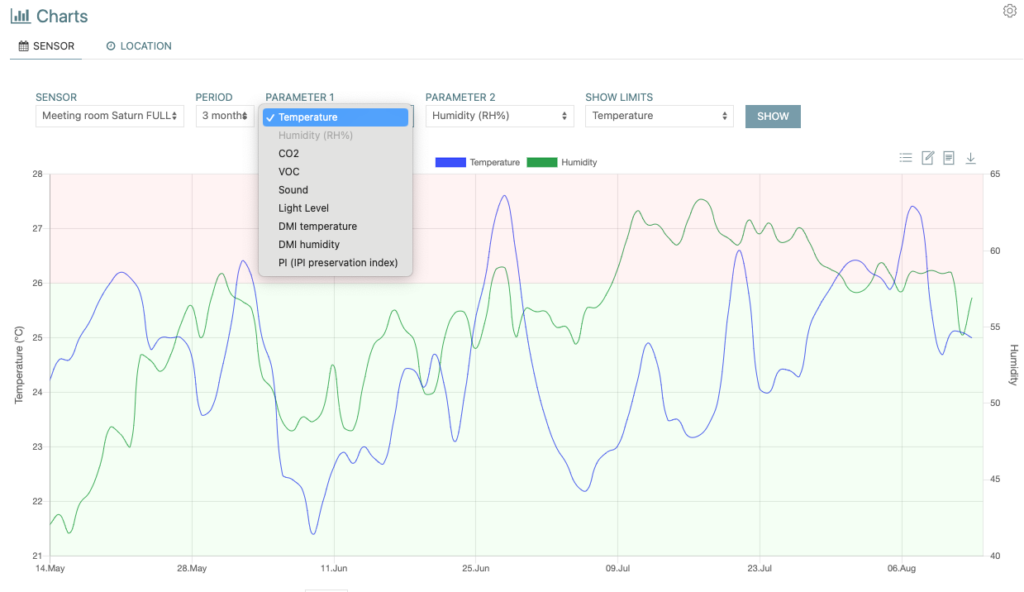
The graph module gives you a clear overview of the indoor climate development over time with data ranging from one day to two years. You can compare up to two values, such as temperature and humidity, temperature and DMI data or CO2 and presence in the room. For those working with conservation, a conservation index is also available. All graphs can be downloaded as PDFs or delivered as reports directly to your inbox.
RoomAlyzer can extract your indoor climate data for your DGNB certification. The report is easily customised to contain exactly the periods/times you need for reporting, and it can be attached to your certification as an appendix so you don’t have to do any ‘Excel gymnastics’.
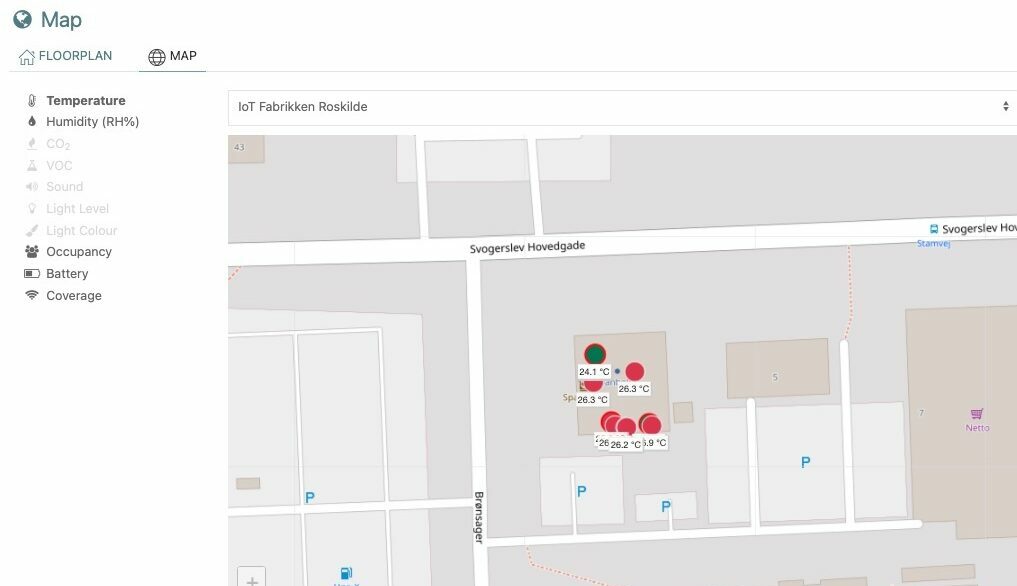
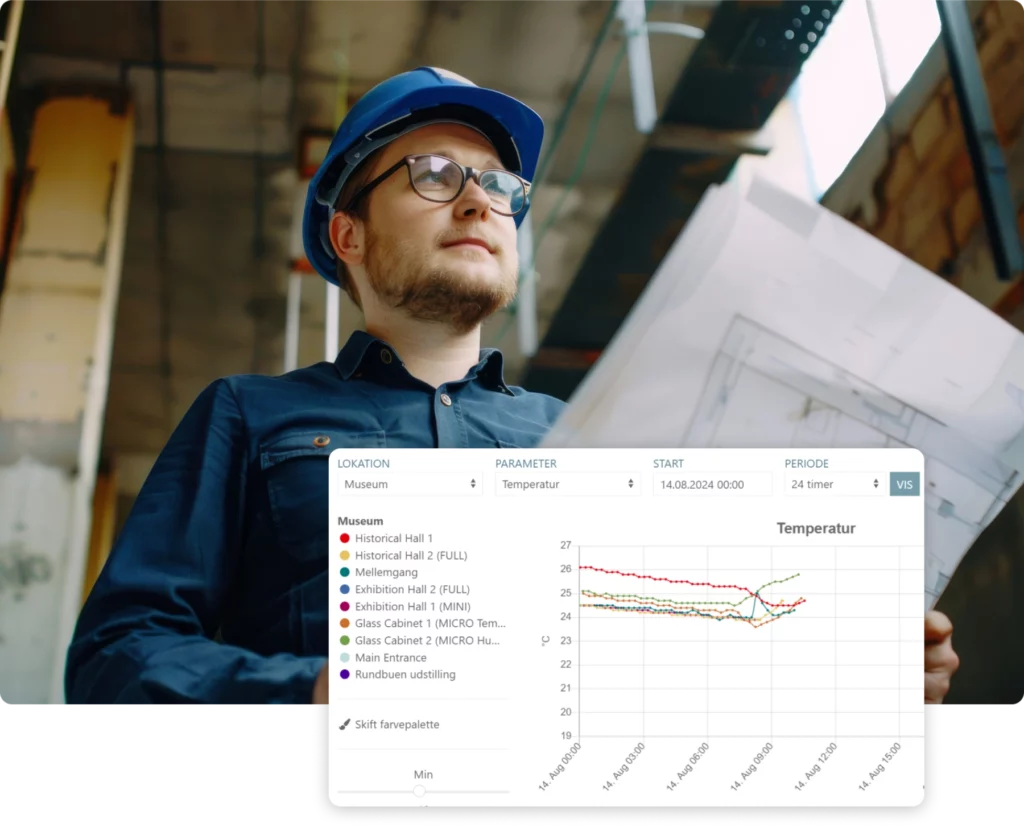
Overview and map
With our overview function, you always have a full overview of your indoor climate sensors, regardless of their location. The feature is designed to give you a quick visual insight into where the indoor climate is running as it should and where there are deviations from the desired values. We use a simple combination of numbers and colour codes so you can easily and quickly read the status of your locations. On our map, you can position the sensors geographically, giving you a visual overview of temperature, humidity, VoC and CO2 levels at all your locations. Among other things, this makes it easy to identify where there is a need for system adjustments or ventilation. The module also comes with the option to place the sensors on floor plans.
Mould
Our mould module helps you avoid costly and troublesome mould damage. You get an ongoing assessment of your mould risk based on data from the last three days and three weeks, and you can follow the development over time with a mould graph. The ‘days to mould’ feature sends you alerts if temperature and humidity levels change negatively, so you can act quickly with dehumidification and heat adjustment.
Report and warning
Our reporting module delivers accurate data directly to your inbox with daily, weekly and monthly indoor climate summaries. You can also send the reports to other users and customise which indoor climate values to include. In addition, the module offers both application and DGNB reports that are ready to use for your DGNB certification, so you don’t have to spend time on Excel.
The warning function notifies you when the indoor climate deviates from the desired level. Early warnings about high humidity, for example, can save you significant costs. You can choose to receive alerts via SMS or email and assign alerts to different recipients.
Graphs and DGNB reporting
The graph module gives you a clear overview of the indoor climate development over time with data ranging from one day to two years. You can compare up to two values, such as temperature and humidity, temperature and DMI data or CO2 and presence in the room. For those working with conservation, a conservation index is also available. All graphs can be downloaded as PDFs or delivered as reports directly to your inbox.
RoomAlyzer can extract your indoor climate data for your DGNB certification. The report is easily customised to contain exactly the periods/times you need for reporting, and it can be attached to your certification as an appendix so you don’t have to do any ‘Excel gymnastics’.
Overview and map
With our overview function, you always have a full overview of your indoor climate sensors, regardless of their location. The feature is designed to give you a quick visual insight into where the indoor climate is running as it should and where there are deviations from the desired values. We use a simple combination of numbers and colour codes so you can easily and quickly read the status of your locations. On our map, you can position the sensors geographically, giving you a visual overview of temperature, humidity, VoC and CO2 levels at all your locations. Among other things, this makes it easy to identify where there is a need for system adjustments or ventilation. The module also comes with the option to place the sensors on floor plans.
Mould
Our mould module helps you avoid costly and troublesome mould damage. You get an ongoing assessment of your mould risk based on data from the last three days and three weeks, and you can follow the development over time with a mould graph. The ‘days to mould’ feature sends you alerts if temperature and humidity levels change negatively, so you can act quickly with dehumidification and heat adjustment.
En forbedring af dit indeklima starter her
Med RoomAlyzer får du blandt andet overblik over:
Ventilation
Sørg for, at din arbejdsplads er godt ventileret for at undgå for meget CO2 og TVOC (flygtige organiske forbindelser) samt fugt og skimmelsvamp, som kan skabe dårlig luftkvalitet og forårsage sundhedsproblemer.
Temperaturkontrol
En for høj eller for lav temperatur kan påvirke produktiviteten og medarbejdernes helbred. Samtidig er varmen dyr, og mange arbejdspladser er blevet pålagt at skrue ned til 19 grader.
Luftfugtighed
Fugten spiller en stor rolle for, hvor hurtigt vira udvikler sig i lokalet. Vi ved, at en luftfugtighed over 40% RH og under 60% RH giver den bedste smitteforebyggelse. Det kan dog være svært at styre, da luftfugtighed påvirkes af det udendørs vejr.
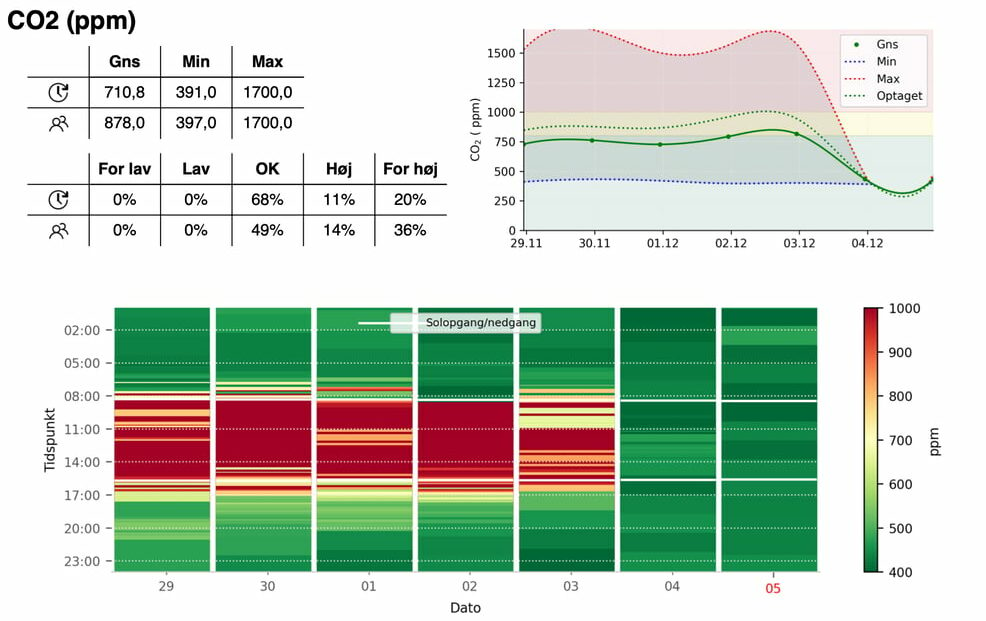
CO2 og TVOC
Ifølge Arbejdstilsynet skal CO2-niveauet helst ligger under 1000 ppm. Samtidig ved vi, at det også er sundest at holde TVOC-niveauet under 700 ppb. TVOC (Total Volatile Organic Compounds) kan både være ting som prutter, parfume og håndsprit, men også afgasning fra arbejdspladsen.
Korrekt belysning
Ved de fleste typer arbejde ligger de krævede værdier på 200 eller 500 lux. Gang-arealer kræver dog kun 100 lux. Det klassiske kontorarbejde, hvor der indgår vedvarende læsning, kræver 500 lux.
Støjniveau
Arbejder du på kontor og sidder i storrumskontor, lyder anbefalingen på et støjniveau på 45-50 dB(A) (altså decibel). Du må ifølge støjbekendtgørelsen aldrig udsættes for daglig støj på mere end 85 dB(A) på jobbet.
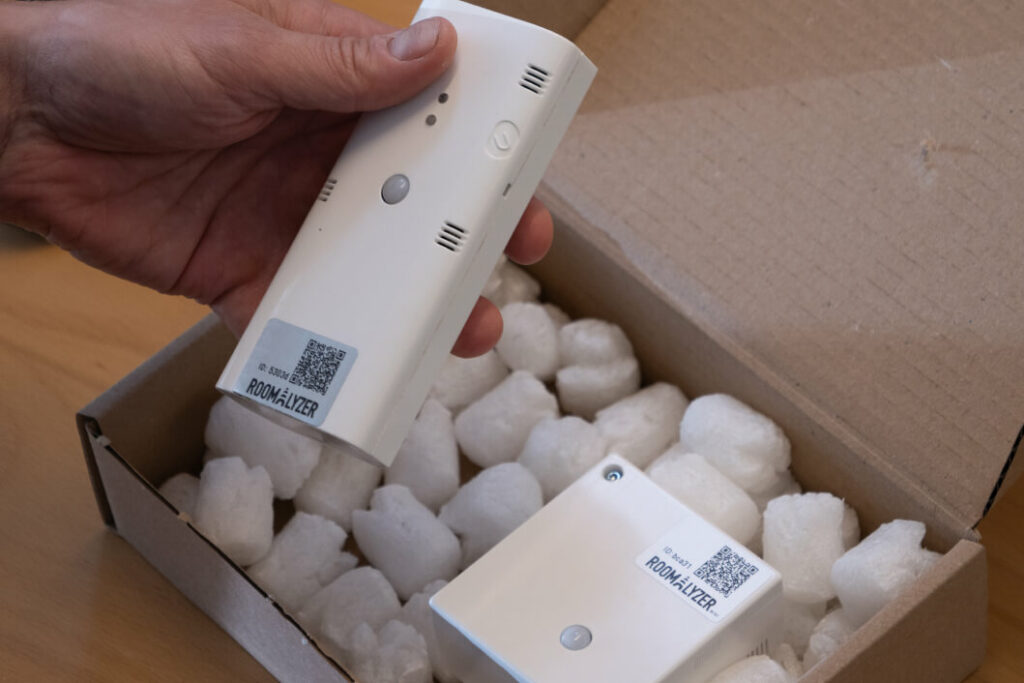
Simple installation – no wires and wifi.
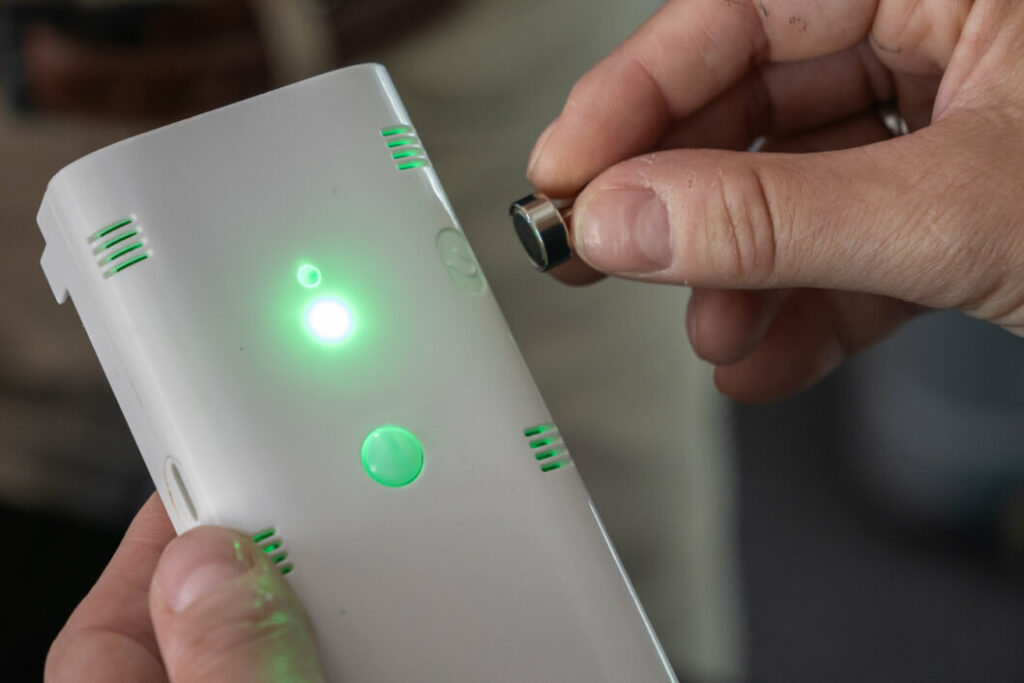
Step 1
You order and receive your sensors
Step 2
You activate the wireless sensors and hang them up
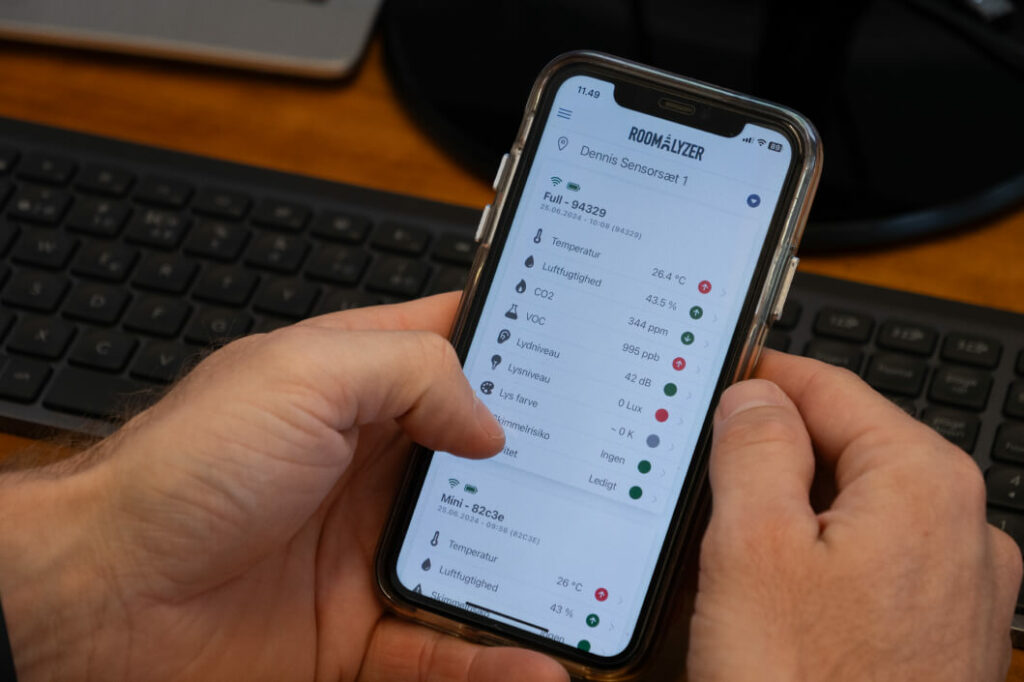
Step 3
You’re up and running and can read data on mobile and PC
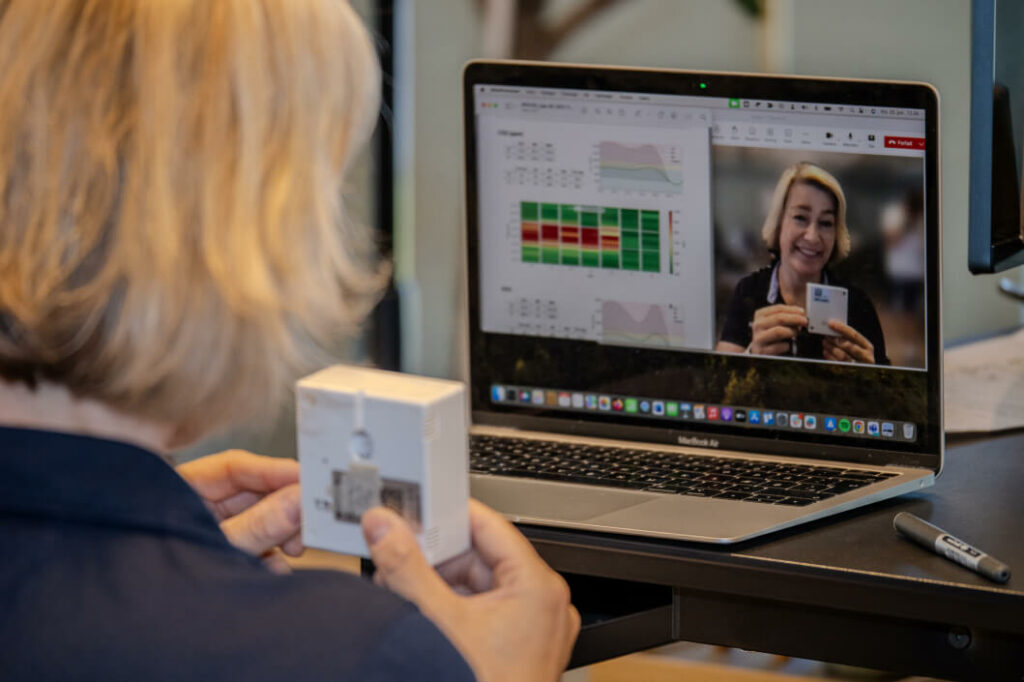
Step 4
You attend an online start-up meeting and get to know the software
It’s super easy, I’m with you all the way in the implementation!
- Cille
We support customers in all segments.
Our solutions give you an overview, save energy and prevent damage.
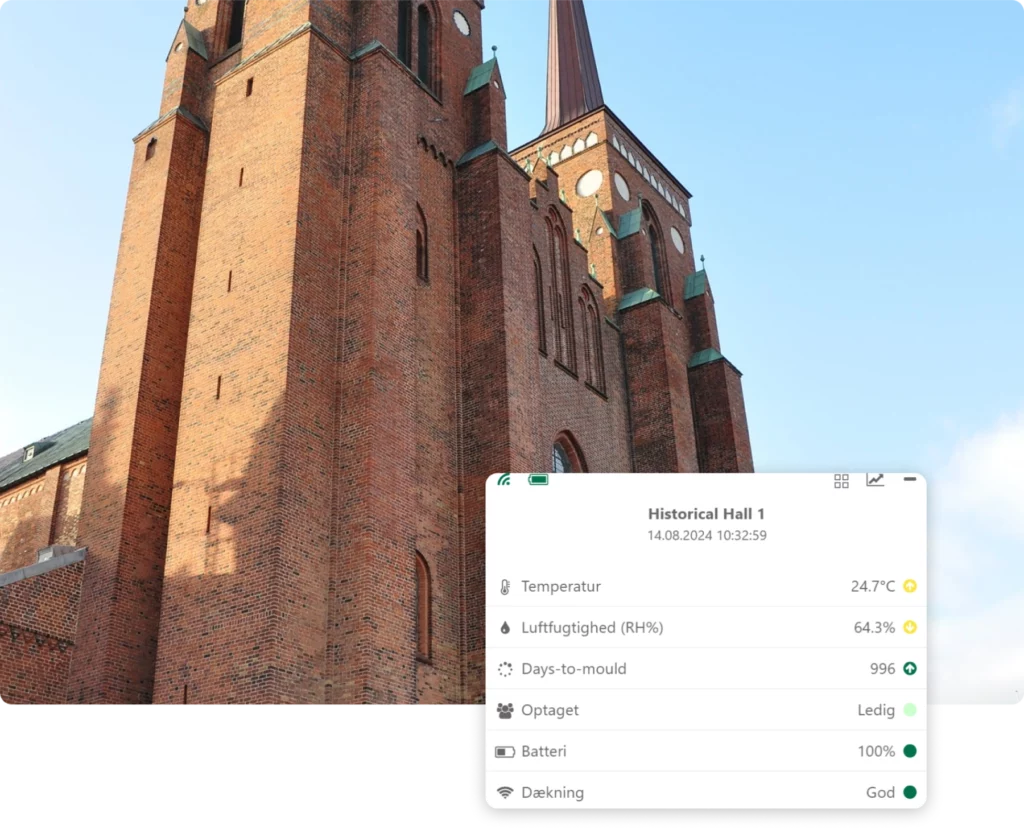
Churches and museums
Businesses and municipalities
Counsellors
Confident decisions based on indoor climate data.
Handling indoor climate complaints
Overview of where you get the most out of improving the climate
Check your systems: Is the CTS performing as it should?
Heat alert: One degree down saves 5% on heating bills
Mould prevention with SMS/email alerts
DGNB: Strengthen your certification by measuring six values at once and get data served in a DGNB report
You get documentation - and better indoor climate.
‘Data instead of debate’, we sometimes say in IoT Fabrikken, not to belittle other people’s feelings and emotions. But simply because data provides a much better and more objective basis to work from when it comes to something as fundamental as indoor climate.
If you work in operations, you know that indoor climate in the workplace is often the source of much discussion. And it makes sense, because it’s about the working environment for everyone in the building.
A good physical indoor climate reduces sick leave and increases employee wellbeing and productivity, while a poor indoor climate results in less wellbeing and complaints. It takes up both your time and your employees’ time and energy.
Curious how we can help you understand your indoor climate?
Curious how we can help you understand your indoor climate?
Give us a call or use the fields to let us know that you would like to know more about the RoomAlyzer system. We’ll get in touch with you as soon as we’ve seen your enquiry and are always happy to drop by – either physically or online. You are also welcome at our cosy office in Roskilde, Denmark.